XL CUX1/EZH2/
7cen
Deletion Probe
- Order Number
- D-5144-100-TC
- Package Size
- 100 µl (10 Tests)
- Chromosome
- 077
- Regulatory Status
- IVDD
IVDR Certification
MetaSystems Probes has already certified a wide range of FISH probes, according to IVDR.
This product remains IVDD-certified until further notice.
Discover all IVDR-certified products
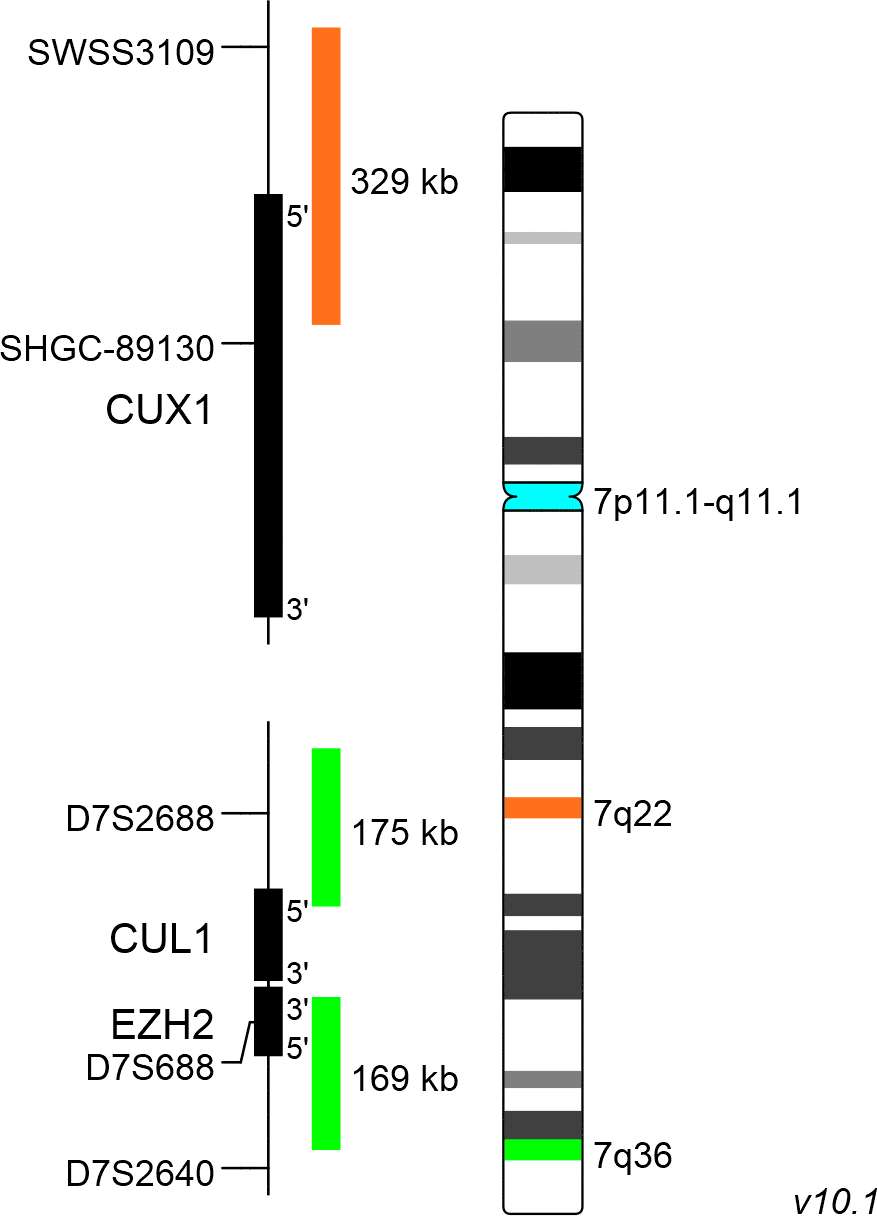
XL CUX1/EZH2/7cen consists of an orange-labeled probe hybridizing to the CUX1 gene region at 7q22, a green-labeled probe hybridizing to the EZH2 gene region at 7q36 and an aqua-labeled probe hybridizing to the centromere of chromosome 7.
Probe maps for selected products have been updated. These updates ensure a consistent presentation of all gaps larger than 10 kb including adjustments to markers, genes, and related elements. This update does not affect the device characteristics or product composition. Please refer to the list to find out which products now include updated probe maps.
Probe map details are based on UCSC Genome Browser GRCh37/hg19, with map components not to scale.
Partial deletions of the long arm of chromosome 7 [del(7q),7q-] or monosomy 7 (-7) are highly recurrent chromosomal aberrations frequently observed in myelodysplastic syndrome (MDS) and acute myeloid leukemia (AML). In MDS and AML, del(7q) as sole cytogenetic aberration has a prevalence of less than 5%. However, many of the examined patients with del(7q) have additional cytogenetic aberrations. Furthermore, whole-exome sequencing studies analyzed the coincidence of mutated genes (e.g. CUX1, LUCL2, CUL1, and EZH2) and -7 or del(7q).
7q deletions are assigned to the intermediate genetic prognostic risk group (ELN risk stratification) or the high risk prognostic group (revised MRC classification), in AML. However, 7q- are classified by the revised IPSS (International prognostic scoring system) as 'intermediate cytogenetic prognostic risk' or 'poor risk' - if coincide with another abnormality, in MDS.
Several deleted regions have been identified along the long arm of chromosome 7, but two critical genomic regions are known to be commonly deleted regions (CDRs): 7q22 and 7q31-q36. Studies focusing on CDRs on 7q have highlighted the significance of the gene loci of EZH2, SAMD9L, CUX1, MLL3, and DOCK4, whose assumed roles as tumor suppressor genes could explain the criticality of their haploinsufficiency.
The CUX1 gene locus has been described as frequently deleted locus in case of 7q deletions, increasing the accuracy of the diagnosis of 7q22 deletions.
Clinical Applications
- Acute Myelogenous Leukemia (AML)
- Myelodysplastic Syndrome (MDS)

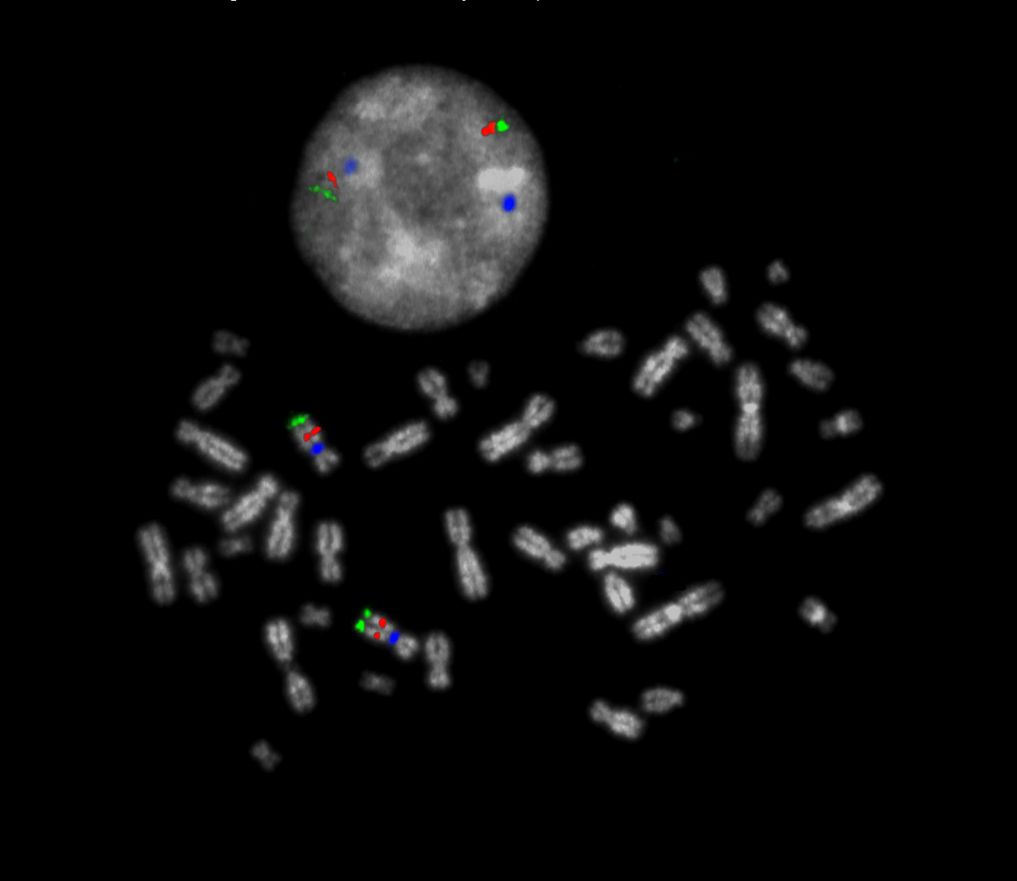
Normal Cell:
Two Blue (2B), two green (2G) and two orange (2O) signals.

Aberrant Cell (typical results):
Two green (2G), one orange (1O) and 2 blue (2B) signals resulting from loss of one orange signal or one green (1G), two orange (2O) and 2 blue (2B) signals resulting from loss of one green signal.

Aberrant Cell (typical results):
Two blue (2B), one green (1G) and one orange (1O) signal resulting from the loss of one green and one orange signal.

Aberrant Cell (typical results):
One blue (1B), one green (1G) and one orange (1O) signal resulting from the loss of one chromosome.
- Le Beau et al (1996) Blood 88:1930-1935
- Struski and Luquet (2019) Ann Biol Clin (Paris) 77:229-230
- Hartmann et al (2019) Genes Chromosomes Cancer 58:698-704
Certificate of Analysis (CoA)
or go to CoA Database


