XL PDGFRA BA
Break Apart Probe
- Order Number
- D-5137-100-OG
- Package Size
- 100 µl (10 Tests)
- Chromosome
- 044
- Regulatory Status
- IVDR
IVDR Certification

This probe is IVDR-certified in compliance with the Regulation (EU) 2017/746 for in vitro diagnostic medical devices (IVDR).
MetaSystems Probes has already certified a wide range of FISH probes, according to IVDR.
Please use the switch to change to the IVDD product.
IVDRIVDDDiscover all IVDR-certified productsDownload Instructions For Use (IFU)Until further notice, we will continue to provide IVDD products in various countries.
As part of our phased rollout, the IVDR-certified probes are now available in Australia, Austria, Bangladesh, Belgium, Chile, Croatia, Cyprus, Czech Republic, Estonia, Finland, France, Germany, Great Britain, Hong Kong, Iceland, Iraq, Ireland, Israel, Italy, Jordan, Kuwait, Latvia, Lebanon, Liechtenstein, Luxembourg, Malaysia, Malta, Morocco, Nepal, Netherlands, New Zealand, Northern Ireland, Oman, Pakistan, Palestine, Philippines, Poland, Portugal, Saudi Arabia, Slovakia, Slovenia, South Africa, Spain, Sweden, Switzerland, Thailand, Turkey, Ukraine, and United Arab Emirates with the list of countries continuously expanding.
Note: Our IVDR-certified XA probes are now available across all EU countries. For more details, please visit the individual product pages.

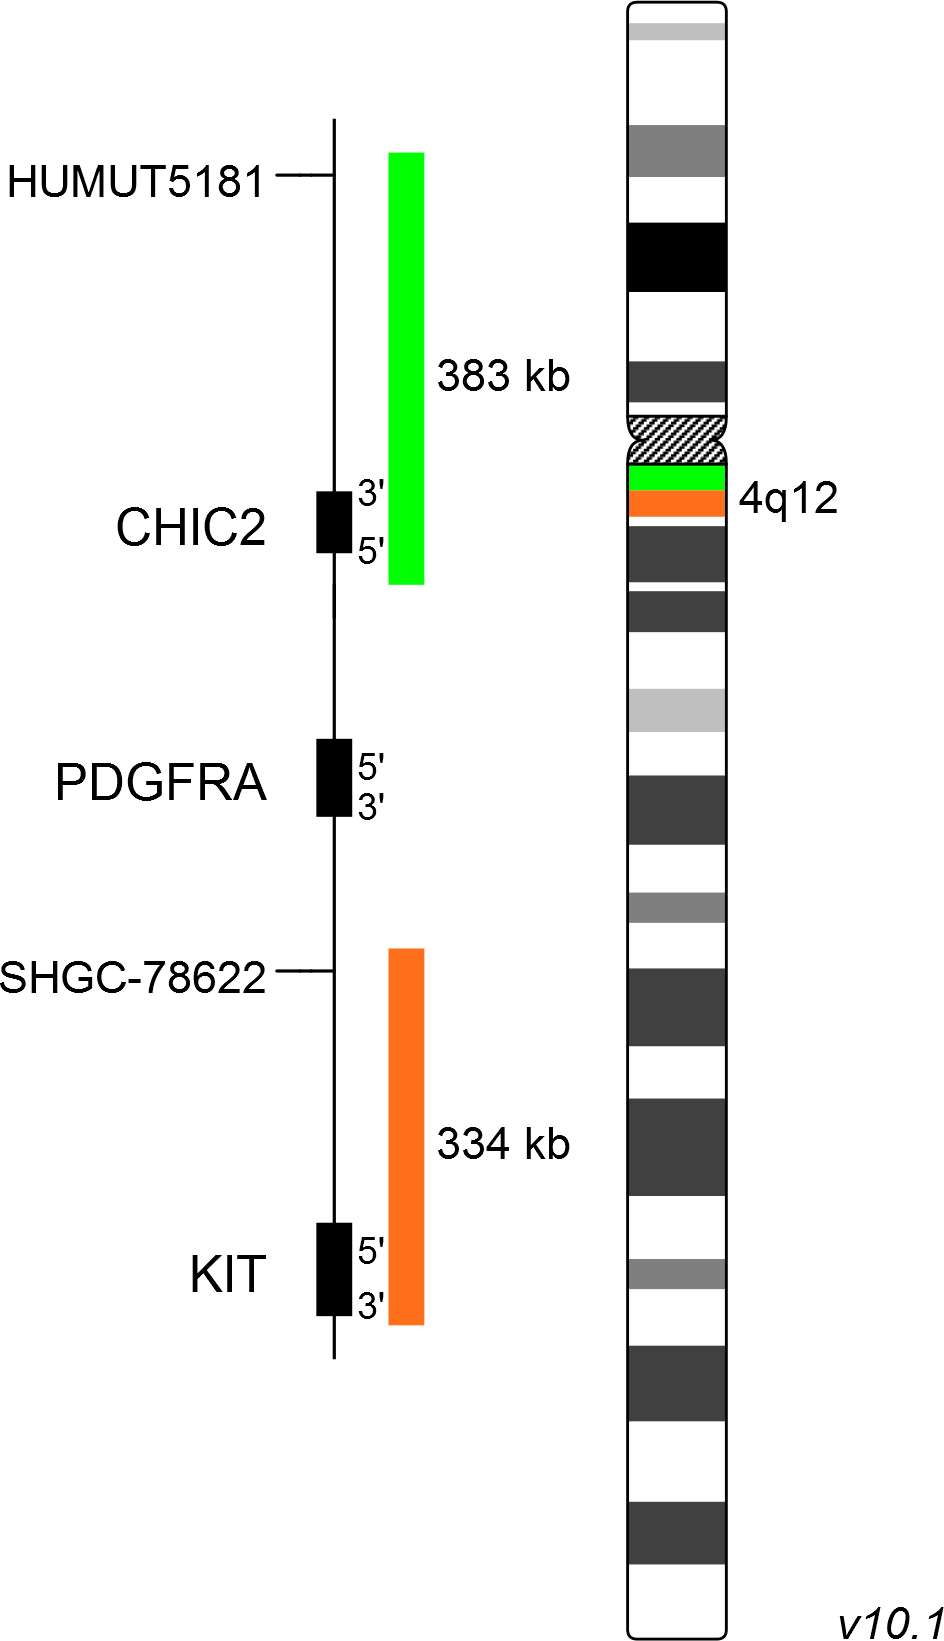
The XL PDGFRA BA probe consists of a green-labeled probe hybridizing proximal to the PDGFRA gene region at 4q12 and an orange-labeled probe hybridizing distal to the PDGFRA gene region at 4q12.
Probe maps for selected products have been updated. These updates ensure a consistent presentation of all gaps larger than 10 kb including adjustments to markers, genes, and related elements. This update does not affect the device characteristics or product composition. Please refer to the list to find out which products now include updated probe maps.
Probe map details are based on UCSC Genome Browser GRCh37/hg19, with map components not to scale.

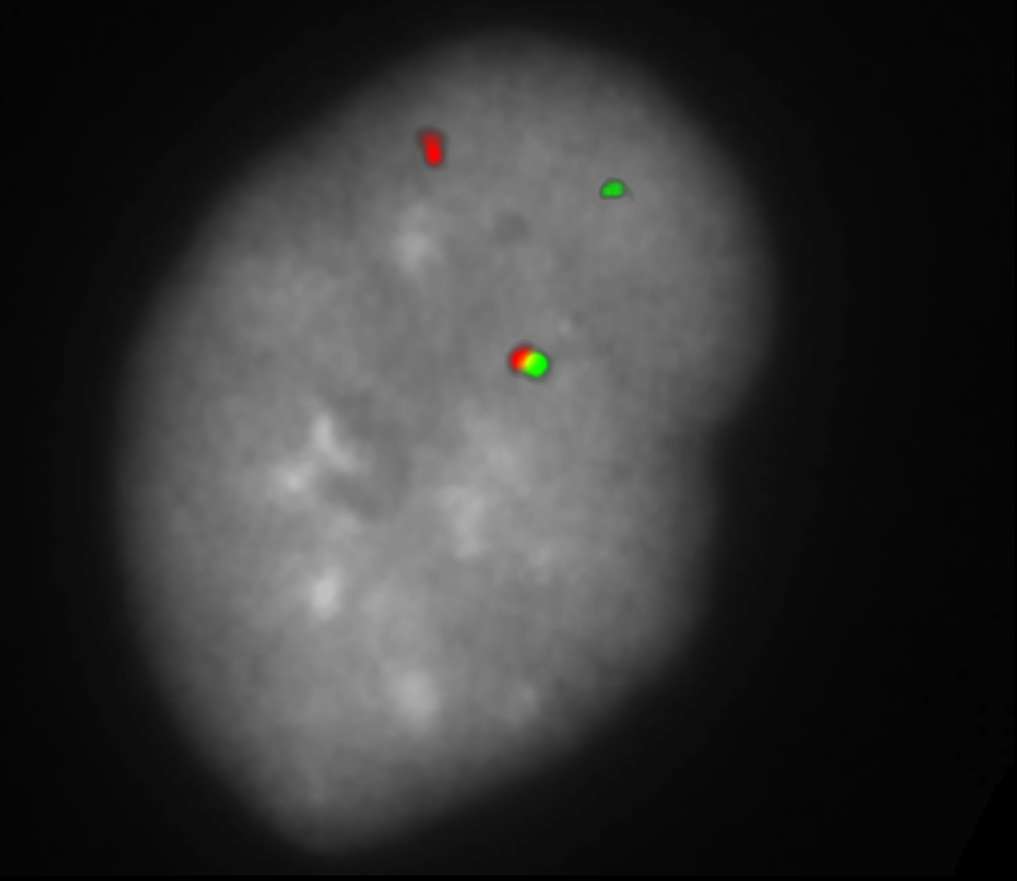
XL PDGFRA BA hybridized to bone marrow cells, one aberrant cell is shown. The expected normal signal pattern of XL PDGFRA BA is two green-orange colocalization/fusion signals representing the two normal PDGFRA loci. Cells with breakaparts typically have one normal green-orange colocalization/fusion signal plus one orange and one green signal clearly separate from one another.

Normal Cell:
Two green-orange colocalization/fusion signals (2GO).

Aberrant Cell (typical results):
One green-orange colocalization/fusion signal (1GO), one separate green (1G) and orange (1O) signal each resulting from a chromosome break in the respective locus.


