XL 5q31/5q33/
5p15
Deletion Probe
- Order Number
- D-5081-100-TC
- Package Size
- 100 µl (10 Tests)
- Chromosome
- 055
- Regulatory Status
- IVDR
IVDR Certification

This probe is IVDR-certified in compliance with the Regulation (EU) 2017/746 for in vitro diagnostic medical devices (IVDR).
MetaSystems Probes has already certified a wide range of FISH probes, according to IVDR.
Please use the switch to change to the IVDD product.
IVDRIVDDDiscover all IVDR-certified productsDownload Instructions For Use (IFU)Until further notice, we will continue to provide IVDD products in various countries.
As part of our phased rollout, the IVDR-certified probes are now available in Australia, Austria, Bangladesh, Belgium, Chile, Croatia, Cyprus, Czech Republic, Estonia, France, Germany, Hong Kong, Iceland, Iraq, Ireland, Italy, Jordan, Kuwait, Lebanon, Liechtenstein, Luxembourg, Malta, Nepal, Netherlands, New Zealand, Northern Ireland, Oman, Pakistan, Palestine, Philippines, Poland, Slovakia, Slovenia, South Africa, Switzerland, Ukraine, and United Arab Emirates with the list of countries continuously expanding.
Note: Our IVDR-certified XA probes are now available across all EU countries. For more details, please visit the individual product pages.

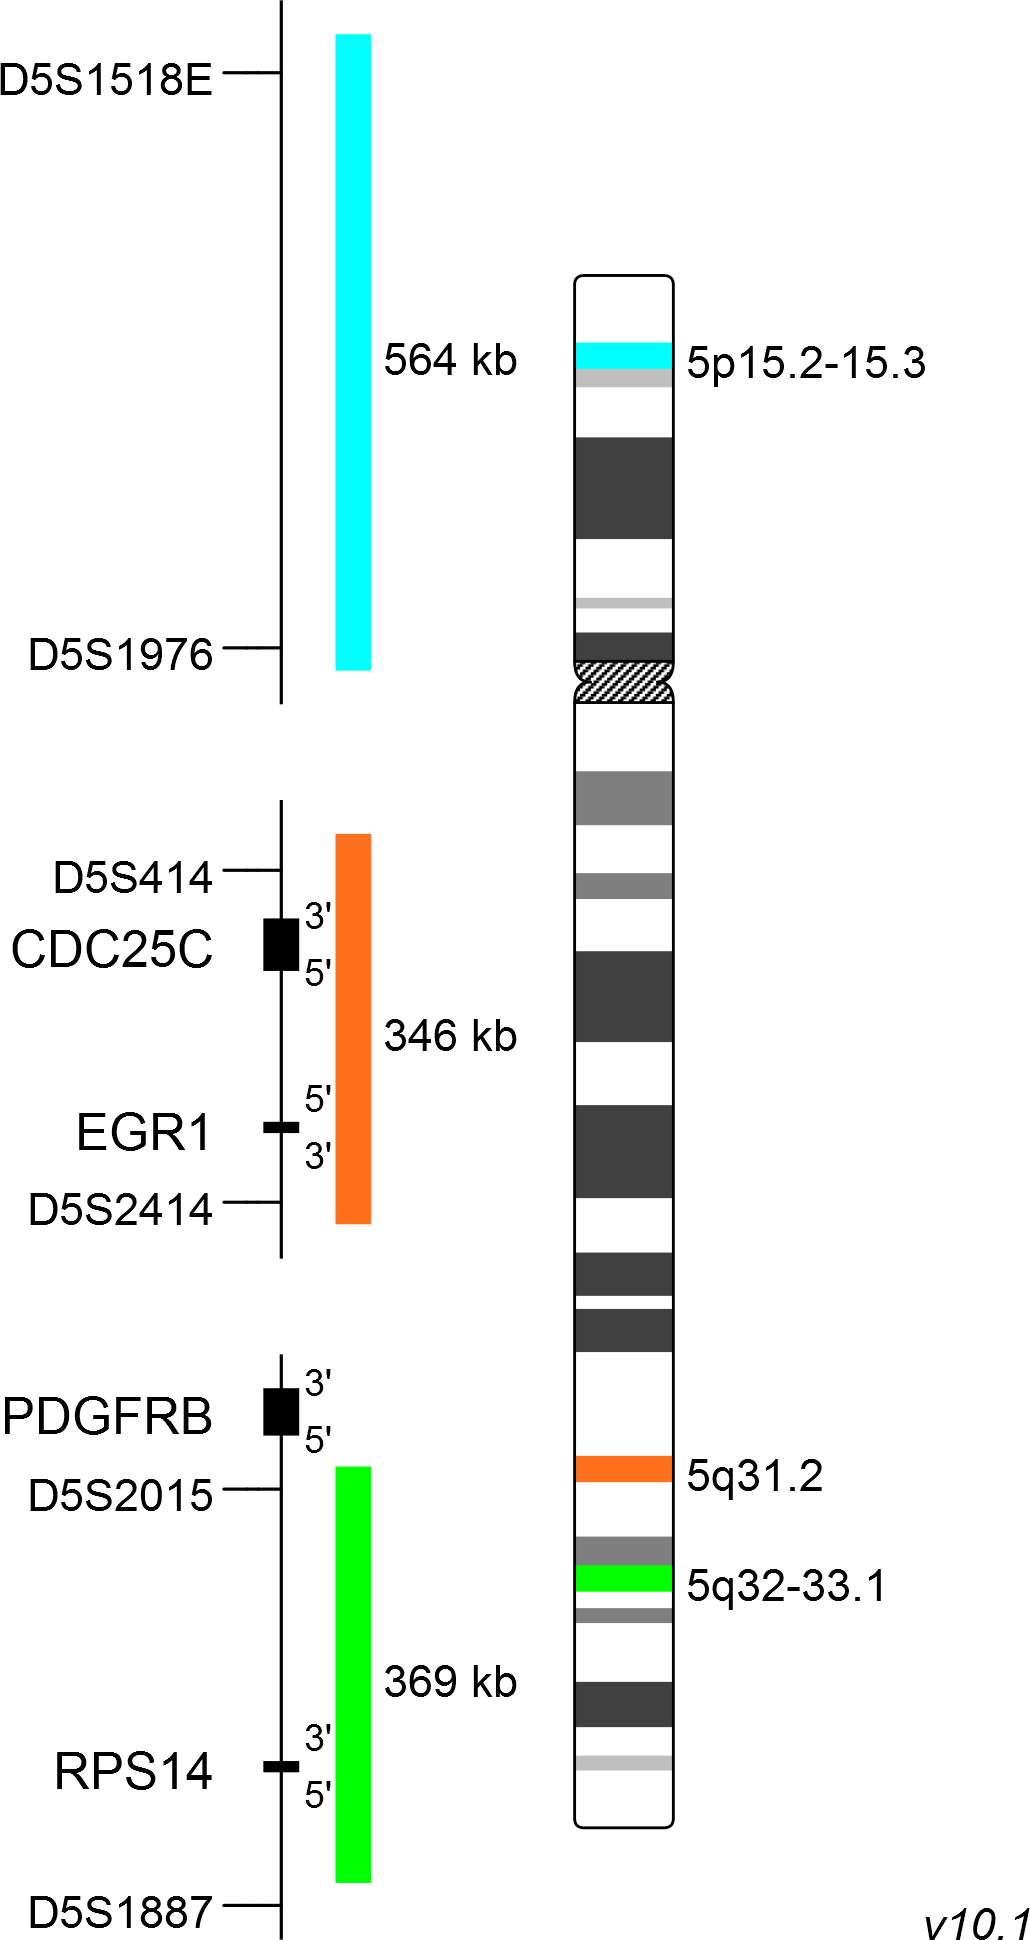
The XL 5q31/5q33/5p15 probe consists of an aqua-labeled probe hybridizing to a region at 5p15.2-15.3, an orange-labeled probe hybridizing to the EGR1 gene region at 5q31.2 and a green-labeled probe hybridizing to the RPS14 gene region at 5q32-33.1.
Probe maps for selected products have been updated. These updates ensure a consistent presentation of all gaps larger than 10 kb including adjustments to markers, genes, and related elements. This update does not affect the device characteristics or product composition. Please refer to the list to find out which products now include updated probe maps.
Probe map details are based on UCSC Genome Browser GRCh37/hg19, with map components not to scale.

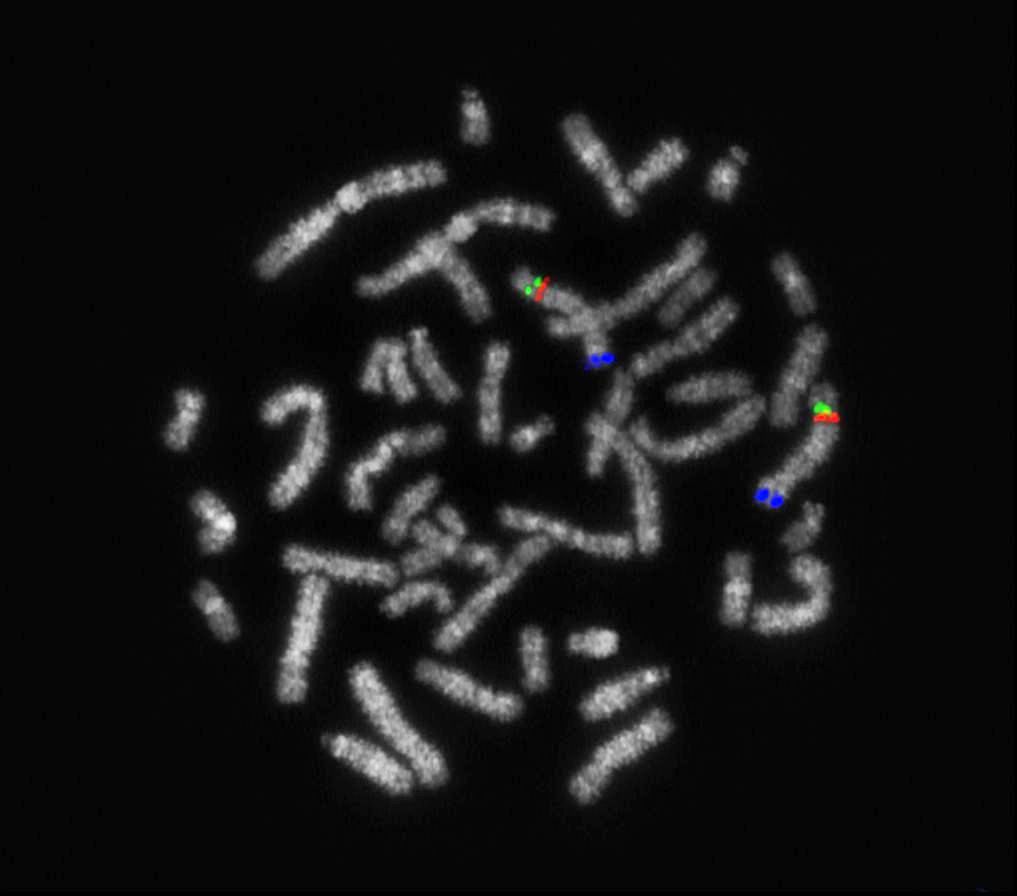
Normal Cell:
Two green (2G), two orange (2O) and two blue (2B) signals.

Aberrant Cell (typical results):
Two blue (2B), one green (1G) and one orange (1O) signal resulting from the loss of one green and one orange signal.

Aberrant Cell (typical results):
Two blue (2B), two green (2G) and one orange (1O) signal resulting from the loss of one orange signal.

Aberrant Cell (typical results):
Two blue (2B), one green (1G) and two orange (2O) signals resulting from the loss of one green signal.


